Inside Tswalu’s annual game count
Tswalu’s annual game count represents more than just numbers on a spreadsheet. It’s a testament to the power of consistent, long-term monitoring in conservation. Over the past 26 years, an invaluable dataset has been created that not only guides management decisions on the reserve but also strengthens and contributes to broader conservation efforts across Africa. Following the 2025 wildlife census, we asked Tswalu’s resident ecologist, Dr Wendy Panaino*, to provide an inside view. If you’ve ever wondered what happens during a game count on a reserve, read on…
It’s impressive that nothing, not even lockdown, disrupted Tswalu’s game count. What is the value of having records dating back to 1999?
It has given us an incredible dataset spanning 26 years – that’s continuous wildlife monitoring across this vast landscape! The count is an estimate of Tswalu’s wildlife population, with the emphasis on ‘estimate’ because we would never be able to get an exact count of everything, particularly on a property as large as this. The objective is to monitor trends over time to identify how species respond to changes in their environment, such as predation or rainfall.
What does Tswalu hope to learn through annual game counts?
We hope to understand population fluctuations so that we can manage accordingly. We need to know when to adapt predator numbers in the case of game number declines, or when to adjust game numbers in the case of increases – you can’t have too many herbivores either, because they have an impact on the veld.
Is it helpful to compare statistics year on year?
It can be tricky to compare stats year on year because things can fluctuate dramatically. For example, if conditions are very cold during game count, you might see a dramatic decrease in your numbers, which doesn’t necessarily reflect a decrease in your population, but rather conditions not being ideal for counting. What is far more valuable is the long-term trends – is there a persistent increase or decrease in the population of any particular species over time?
What does a game count take in terms of resources?
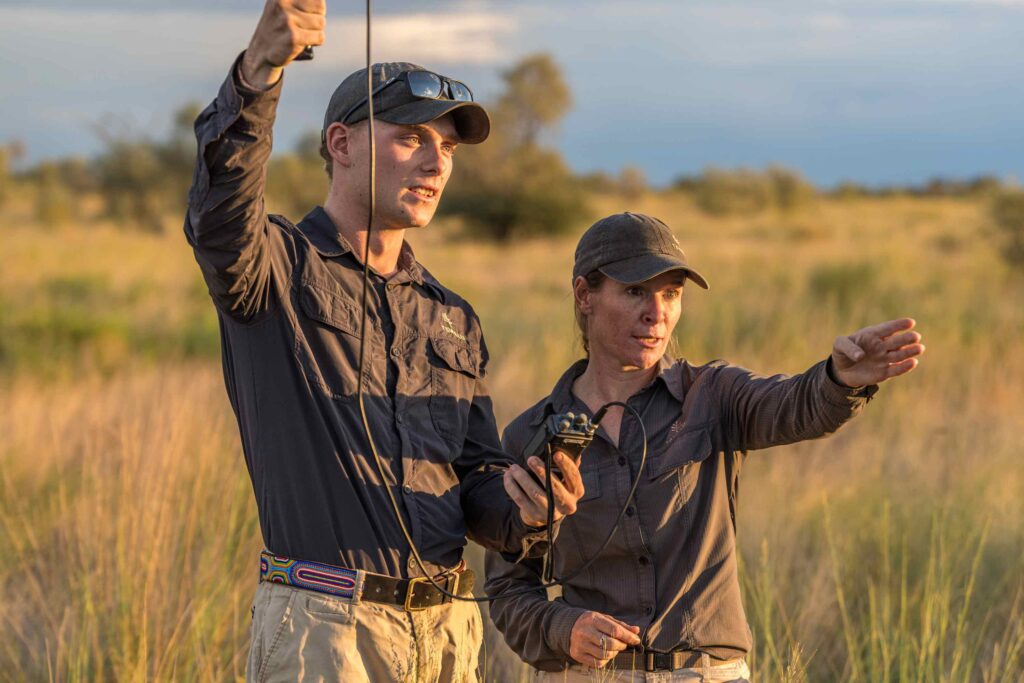
It takes tremendous teamwork to pull off an operation like this, as it involves everyone from conservation to hospitality.
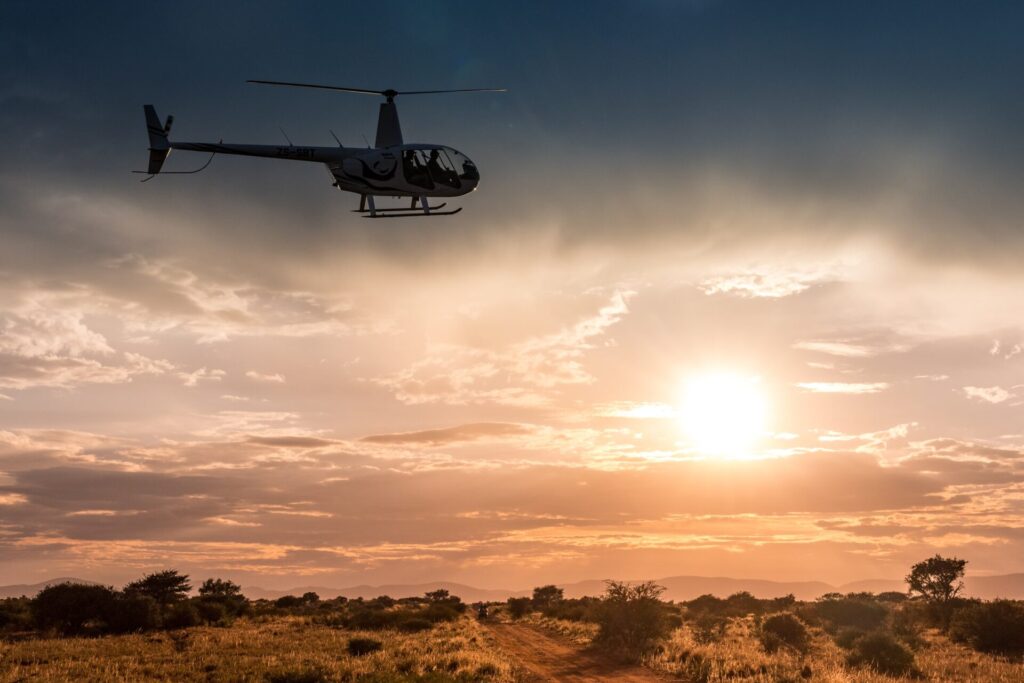
The count requires a helicopter and eight people directly involved in the counting process: two pilots, four counters (two on port side and two on starboard), and two data capturers. There are two open seats in the helicopter filled by observers. Sessions for observers, who may include conservation students, invited members of staff or the family, are rotated to allow as many people as possible to experience the count. It’s a great opportunity for others to see what we do and how we do it, as well as to view Tswalu from an entirely different perspective.
The airstrip fire team and maintenance crew are on standby for refuelling, and there is also an extra pilot to do helicopter setup and checks before each session. Camp staff are on hand to provide drinks and snacks during breaks, and the teams at Motse and Kraal host all those who need accommodation.
How long does a typical game count take?
The count usually takes four days, across 10 sessions. The team meets at the airstrip at 06:30 for morning sessions, and again at 14:30 for afternoon sessions. Time in the air depends on the session but can be between 150-250 minutes. There might be delays if it rains.
How do weather conditions impact the results?
The best conditions are clear, sunny skies. Cold, cloudy, or rainy weather can make it challenging to spot animals because they might be tucked into vegetation, lying in the grass, or underground in burrows. Cold weather is also unpleasant for those who are counting, as they sit for long stretches in a helicopter with the doors off.
Which animals or species are typically counted?
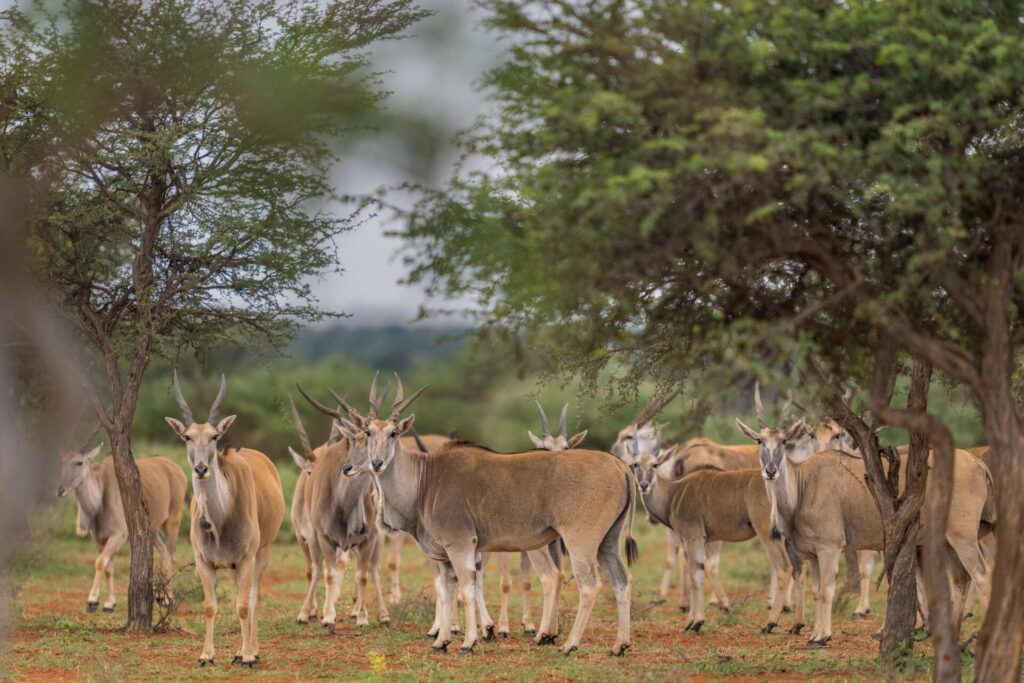
Everything that has four legs! On a more serious note, we do count everything we see, but we’re particularly interested in the herbivores.
Are certain species harder to account for?
Absolutely. Some species blend into backgrounds better than others, some are small like steenbok and duiker, and behavioural patterns make certain species challenging to spot. Steenbok, for example, freeze first and runs later, making it hard to detect when motionless. Some herbivores, like kudu, seek shade earlier than others; mountain zebras are in the mountains where colour and shape contrast might change; Klipspringer, found exclusively in mountains, are rarely spotted due to their freezing behaviour and cryptic colouring. For elusive mountain species, like klipspringer and mountain reedbuck, the team depends on Earth Ranger reporting throughout the year.
How do you know you’re not counting the same animals twice?
The pilots fly along predefined routes (the same routes every year, with new strips added as the reserve has expanded) so that, in theory, we cover all areas with zero overlap. They let us know when to start counting. The counters work in teams of two (port side and starboard) and report only to the data capturer on their side. For example, if I spotted 10 gemsboks on my side, I would communicate it in the following sequence: ‘Gemsbok 10, zone 2’. This way, the data capturer knows which side of the helicopter the sighting was reported from and can capture the information easily into a specially designed computer program in an easy sequence. The computer is also linked to a GPS device that logs the location of each sighting, which is useful for plotting species distribution later.
What do you do with the data collected during the count?
After each count, I write a report – a high-level summary of the count including who counted, what method was used, weather conditions, summary of numbers per species (including explanations for any odd or unusual numbers), and anything important to be flagged. This is critical because once you have long-term data, if you happen to notice something odd from one year to the next, you can go back to the report to see if there was anything weird that happened during the count that can explain the anomaly.
Analysis of the data forms part of the longer-term trends, and the conservation team can act if needed. We can also use the current numbers to project future population change, depending on the species and the context.
What does reporting with ‘real-time context’ mean?
It would be extremely difficult for someone off-site to interpret ecological data for Tswalu without having the on-site context. Imagine historically stable kudu numbers suddenly dropping to less than half the historical average. Without context, you might panic and sound alarms. However, being on-site, you might know through observation, research, or ground surveys that kudu numbers are fine, and this count was likely an anomaly. Context prevents premature assumptions. Another example is that you might think that low numbers indicate too few breeding females, but on-site knowledge reveals many breeding herds and juveniles thriving in the area.
Is information gathered during the census shared with other conservation bodies?
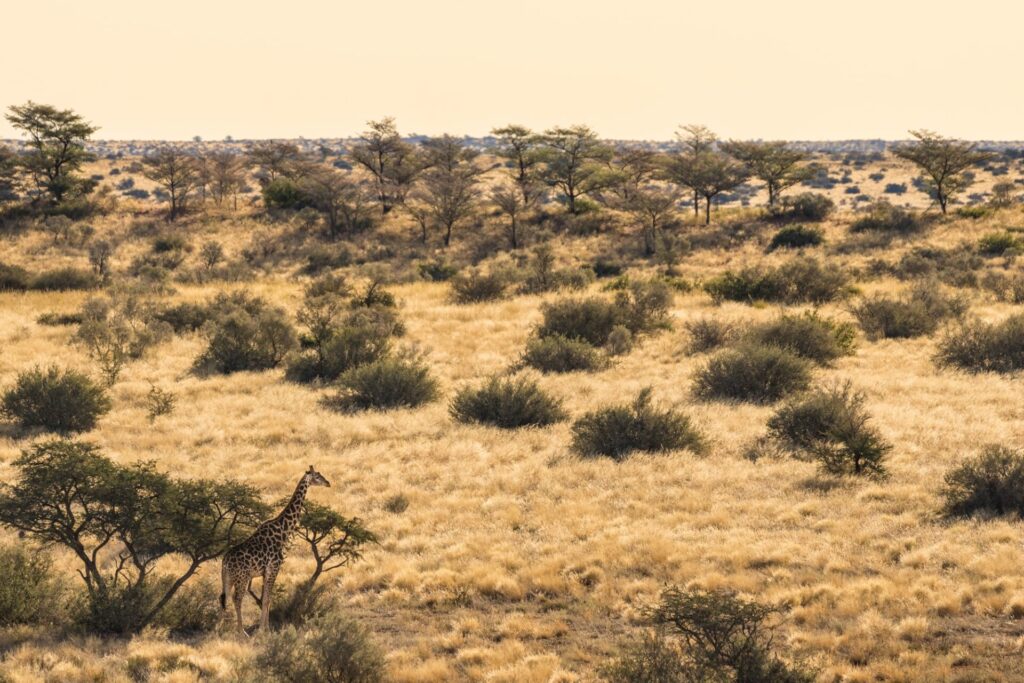
We do share upon request. For example, recently we shared our historical giraffe count data with the Giraffe Conservation Fund to be part of the national census for the species – a perfect example of how local data contributes to broader conservation efforts.
What do you enjoy the most about being part of this annual event?
It is such a privilege to be part of a great team, and to have your office in the sky for a change. To see Tswalu from the air gives a different perspective. I’m also a giant data nerd, so being part of something like this, knowing that more great data is coming through that I can get my hands on later, is extremely exciting.
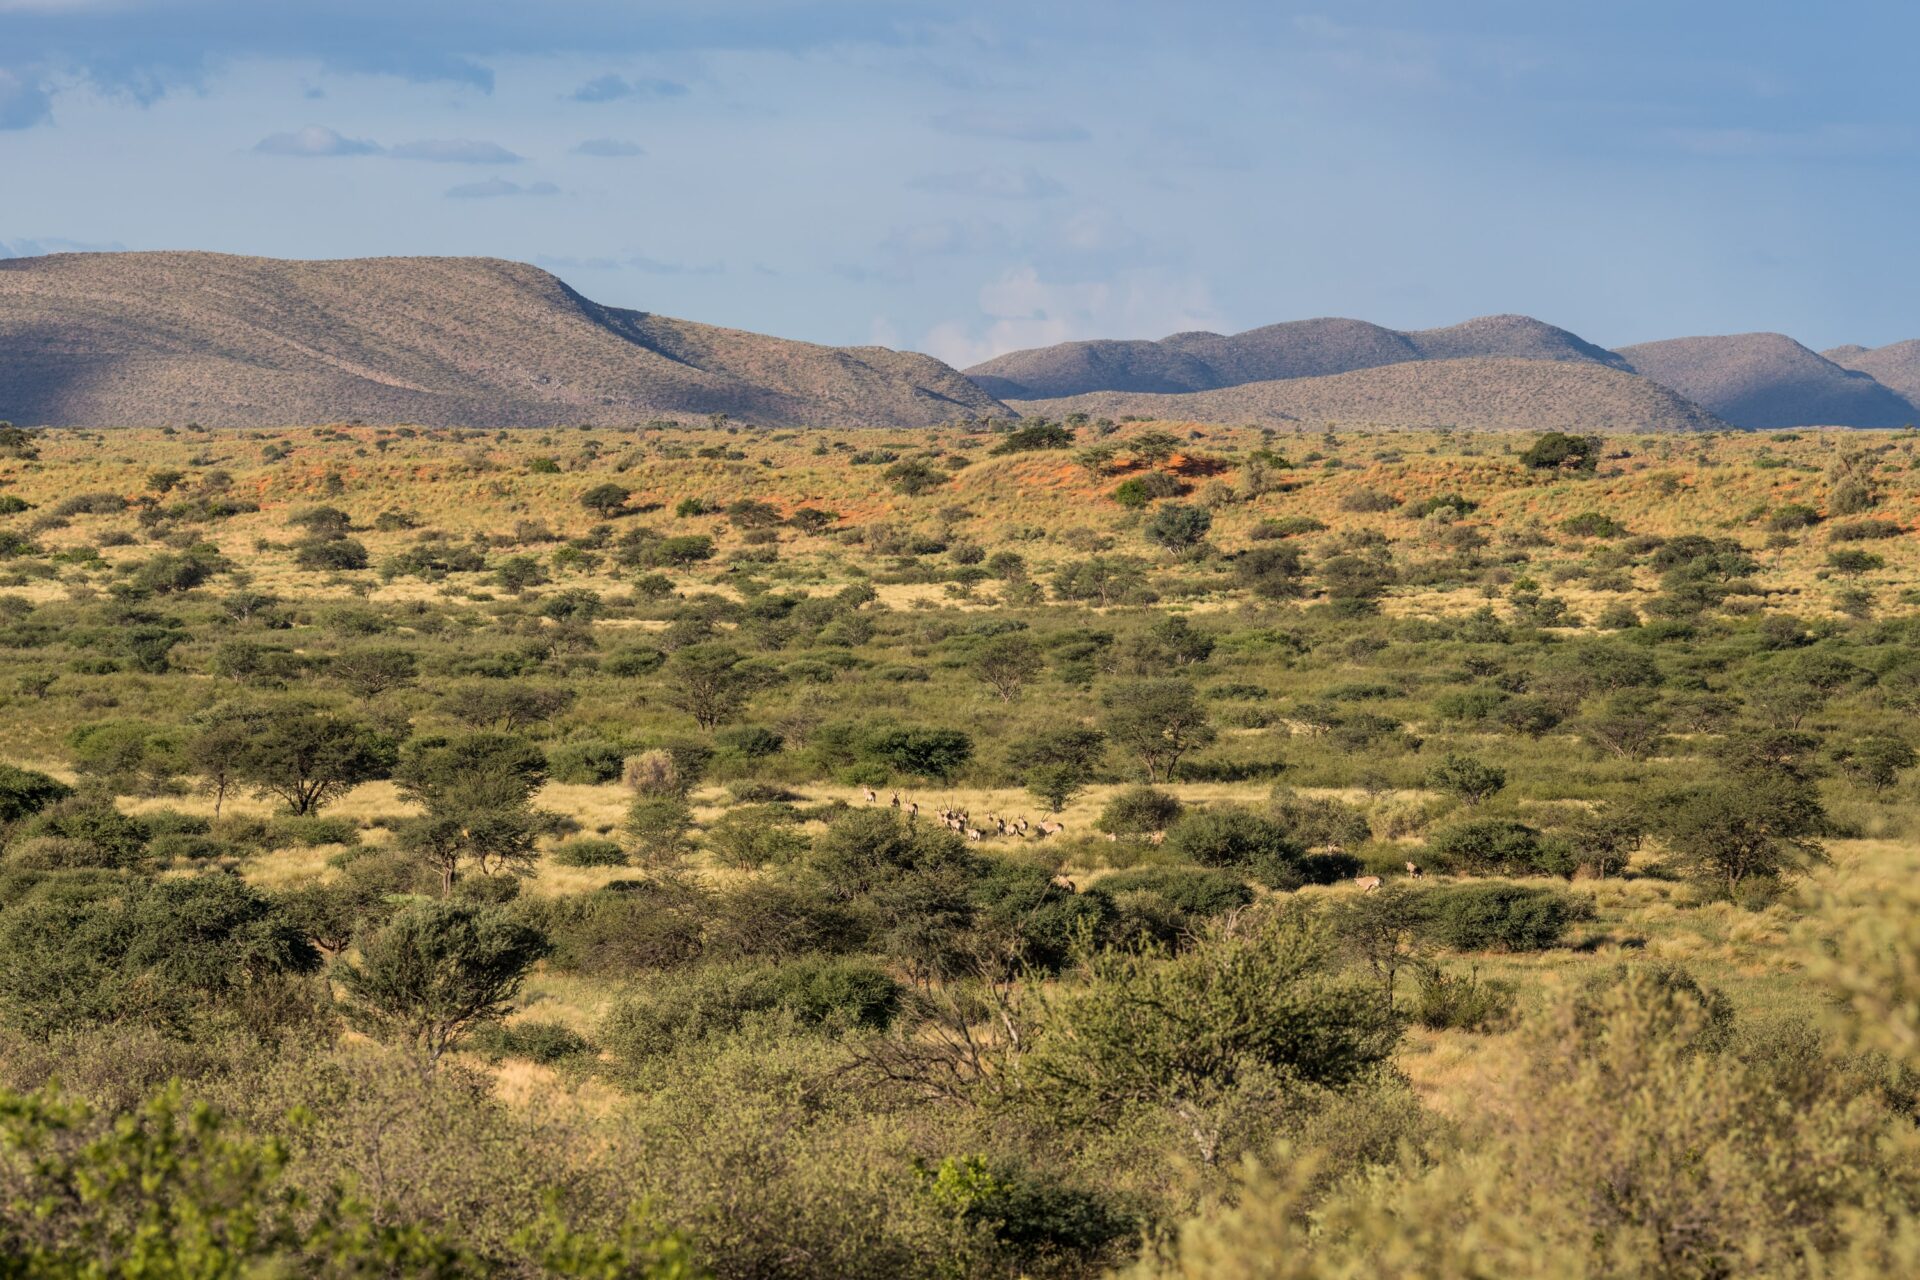
The magic of the annual count lies not just in the tried-and-tested methodology or impressive logistics, but in the dedicated team who, year after year, brave the cold and spend hours in the sky, eyes trained on the landscape below, contributing to this impressive long-term study. Monitoring wildlife numbers plays an important part in understanding and protecting the fragile Kalahari ecosystem in a privately protected area, like Tswalu.
*About Dr Wendy Panaino:
As Tswalu’s resident ecologist, Dr Wendy Panaino ensures that accurate ecological data is gathered, analysed, and reported to better inform decision-making on the reserve. Wendy monitors various wildlife species on Tswalu, analyses and reports on complex ecological data, and mentors the annual intake of third-year conservation students. She also facilitates fluid communication between the conservation and guiding teams to ensure that guides are well informed about Tswalu’s various conservation projects, many of which are major success stories.